
Explore Data
- 2014 Feb 01
- 2023 Aug 19
- 2023 Jul 15
- 2023 Jun 17
- 2023 Nov 18
- 2023 Oct 14
- 2023 Sep 16
- Average of All Waves
Crosstab with
Crosstab with any other Questions
Filter by response option
Marital
- Divorced
- I prefer not to answer
- Living together as married
- Married
- Separated
- Single
- Widowed
Education
- Bachelor's degree
- Completed elementary school
- Completed secondary/high school
- Completed technical, community college, CEGEP
- I prefer not to answer
- Master's degree
- No schooling / some elementary school
- Professional degree or doctorate
- Some secondary/high school
- Some technical, community college, CEGEP
- Some university
Employment
- Caring for a family
- Disabled
- I prefer not to answer
- Other (specify)
- Retired
- Self-employed (with or without employees)
- Student
- Unemployed/looking for work
- Working for pay full or part time (includes on paid leave)
Filter by response option(s) of any other question
Search
Results
Add Group | 2014 Feb 01 |
|---|---|
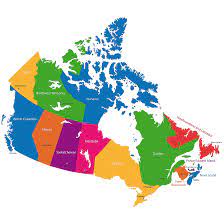
Newfoundland and Labrador | 3.21% |
Prince Edward Island | 1.80% |
Nova Scotia | 6.61% |
New Brunswick | 5.99% |
Quebec | 19.23% |
Ontario | 17.71% |
Manitoba | 5.96% |
Saskatchewan | 5.69% |
Alberta | 16.09% |
British Columbia | 17.71% |
| Sample Size | 9,947 |
| Calculated by Voxdash | |
| General Papulation | |
| Respondent qualification age | 18+ |
| Data Sampling | Unknown |
| Regions | Canada |
| Coverages | Provincial/State |
pages.question.[[...params]].IranAnalyticsFieldsAnOmnibusTelephonePollOfTheIranianPeopleOnAnOngoingB
pages.question.[[...params]].Accept
pages.question.[[...params]].Reject
 Main Graphics
Single view
See All
Pie Chart
Maps

Each Response:
British Columbia
All Responses
Canada - Base Map - British Columbia
Canada - Base Map - Majority
Regional results
Information of Provincial Diversity Project, 2014 Dataset
Overview
Files
Metadata
Limitation
Technical Info
Network
Contract
Citation